R Code
|
unlist(strsplit("a, b, c", split=", ")) [1] "a" "b" "c" |
Introduction to data cleaning with R http://cran.r-project.org/doc/contrib/de_Jonge+van_der_Loo-Introduction_to_data_cleaning_with_R.pdf |
HeatMap
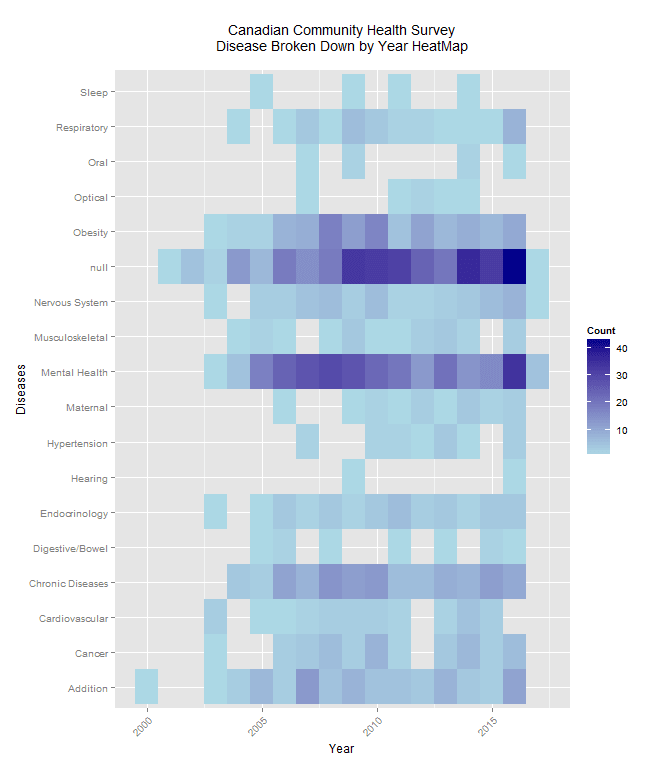
|
library(reshape2) library(ggplot2) synthesis <- read.table("c://users/yergens/desktop/heatmapdata.csv", header=TRUE, sep=",", stringsAsFactors = FALSE) ggplot(data = synthesis, aes(x = Year, y = Diseases)) + geom_tile(aes(fill = Count)) + scale_fill_gradient(low="lightblue", high="darkblue") + ggtitle("Canadian Community Health Survey\nDisease Broken Down by Year HeatMap\n") + theme(axis.text.x = element_text(angle = 45, hjust = 1)) #Convert data from Long to Wide (not needed for Heat Map) data_wide <- reshape(synthesis, idvar = "Diseases", timevar = "Year", direction = "wide") |
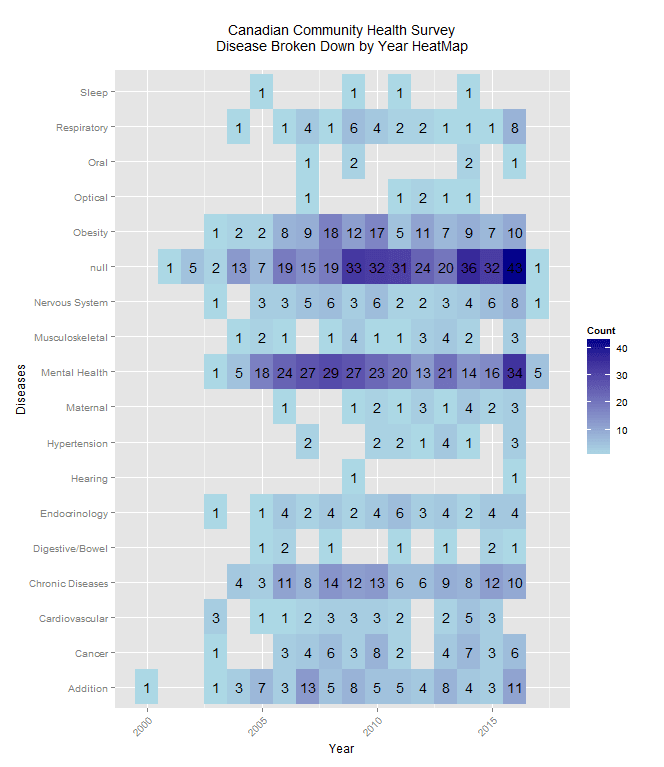
|
library(reshape2) library(ggplot2) synthesis <- read.table("c://users/yergens/desktop/heatmapdata.csv", header=TRUE, sep=",", stringsAsFactors = FALSE) ggplot(data = synthesis, aes(x = Year, y = Diseases)) + geom_tile(aes(fill = Count)) + geom_text(aes(label = Count)) + scale_fill_gradient(low="lightblue", high="darkblue") + ggtitle("Canadian Community Health Survey\nDisease Broken Down by Year HeatMap\n") + theme(axis.text.x = element_text(angle = 45, hjust = 1)) #Convert data from Long to Wide (not needed for Heat Map) data_wide <- reshape(synthesis, idvar = "Diseases", timevar = "Year", direction = "wide") |
|
cchs <- read.table("c://users/yergens/Desktop/cchsif.csv", header=TRUE, sep=",", stringsAsFactors = FALSE)
names(cchs) hist(cchs$meta_SNIP2014, main = "Scopus Journal Metrics (2014)", xlab = "Source-Normalized Impact per Paper (SNIP)") hist(cchs$meta_SJR2014, main = "Scopus Journal Metrics (2014)", xlab = "SCImago Journal Rank (SJR)") summary(cchs$meta_SNIP2014) summary(cchs$meta_SJR2014) library(sqldf) yearchart <- sqldf("select Year, count(*) as cnt from cchs group by Year order by Year") plot(yearchart$Year, yearchart$cnt, type="n", main="Publication Year Breakdown for Cycle 2.1", xlab="Year", ylab="Publications") lines(yearchart$Year, yearchart$cnt) |