Dean Yergens
  • Home
    • Calendar
    • Resume
    • Publications
  • Software
    • Synthesis >
      • Current Version
      • Synthesis Tutorials
    • RMail
    • Meta Data Repository
    • Patient-X
    • WebReports
    • HealthSim Calendar Gadget
    • MT4Health
    • Amazon ISBN 2 BibTex
    • ForestRanger
    • Alberta Sepsis Network
    • R Code
  • Global Health
    • Software
    • Philippines
    • Malawi
    • Zambia
    • Kenya
    • World Health Organization
    • Verbal Autopsy
    • Space Medicine
  • Computer Science
    • Robotics
    • Data Management
    • GPU Parallel Processing
    • Machine Learning
    • Visualization
    • Operating Systems
    • Programming Languages
    • Software Engineering
    • Simulations
    • Computer Configurations
    • Single Board Computers
    • IEEE RSS Feed
    • Glossary
    • Commercial Software Blog
  • Health Sciences
    • AI Walkthrough
    • Canadian Health System Books
    • Microsimulation
    • Graph Databases (Neo4J)
    • Administrative Data
    • CCHS Overview
    • Literature Reviews >
      • Newspaper Literature Reviews
      • Open Access
      • Statistics Utilization
      • Topic Modeling
      • Utilizing R for Literature Reviews
    • Statistics >
      • RMedicine (RClub) >
        • Blog
        • Forums
    • Health Informatics >
      • DataMergeR
      • Dashboards
      • Academic Software Development
      • Critical Care Systems
      • Patient Flow >
        • Patient Flow Simulations
        • Systems
      • HL7
    • Online Courses
    • Public Health Documentaries
    • Summer Institutes
    • WHO Internships
    • Conferences
  • Collection
    • Hardware
    • Software
    • Looking for
    • Analog Computers
    • Old Monitor Projects
    • Computer Books and Software
    • 3D Models
    • FrostByte
    • New Devices Vintage Computers
    • Floppy Music
    • History of Workstations
  • Other
    • Future Projects
    • Home Automation
    • Animatronics
    • Raspberry Pi
    • Deaner.AI
    • CANMAR
    • EpiComics
    • The Art of Deaner
    • LED Cube 8x8x8
    • Ambient Devices
    • EasyButton
    • African Art
    • Movie Posters
    • Wildlife Photography
    • Coursera
    • Neat Companies
  • Blog

Visualization Wall at the University of Calgary (TFDL)

10/2/2015

0 Comments

 
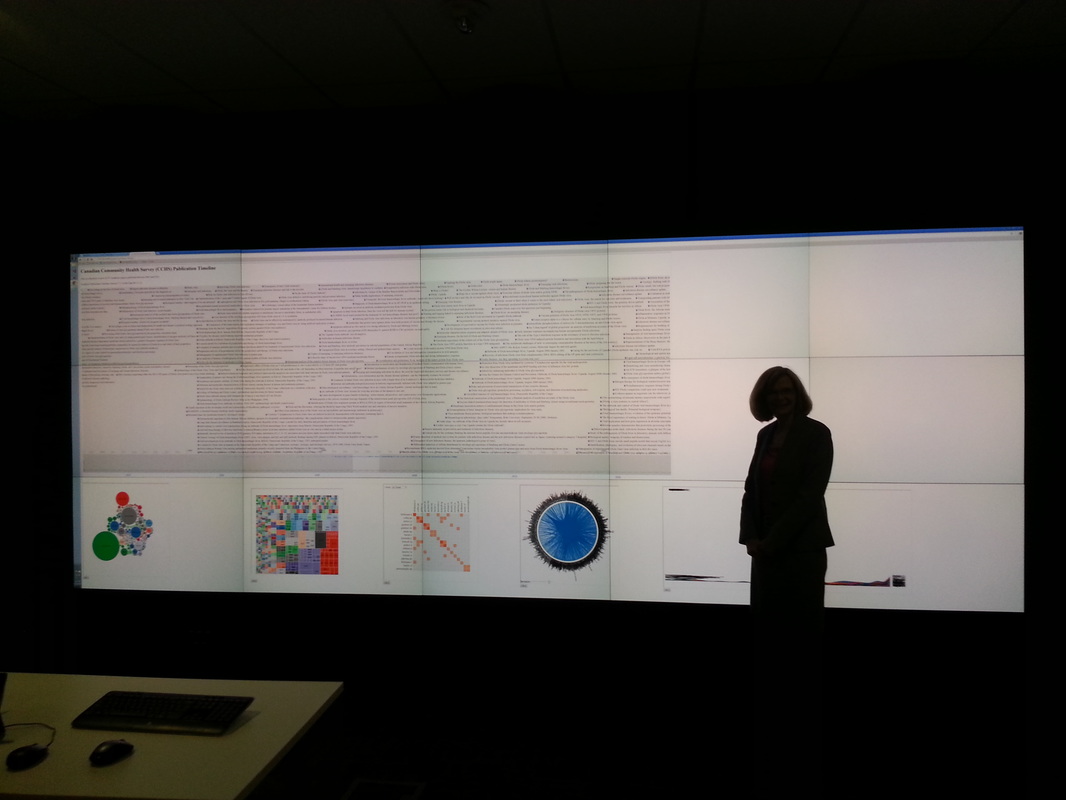
The Visualization Studio at the University of Calgary has a VisWall with 34.5 million pixels for a resolution of 9600x3600.  It is 16 feet by 6 feet. The following are some visualizations we just explored using this technology.

About the Visualization Studio:
https://library.ucalgary.ca/faculty-instructor-support/visualization-studio

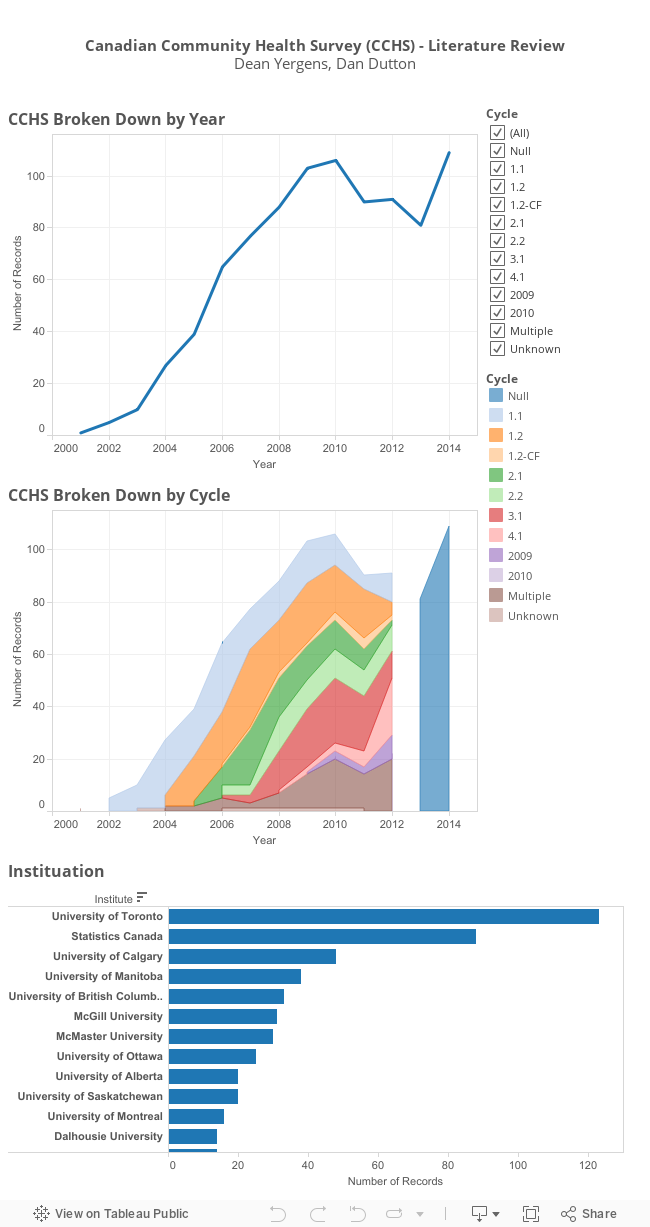
Publication Dashboard - The following image shows a Publication dashboard generated from the Synthesis literature review software. The top section displays the publication titles on a timeline.  The bottom section shows a variety of aggregated data such as author associations, journal by country (bar, pie, line, stacked bar, etc), and journal by year frequency (treemap). Two visualizations were displayed - Overview of the Canadian Community Health Survey and Overview of Ebola publications.
Picture
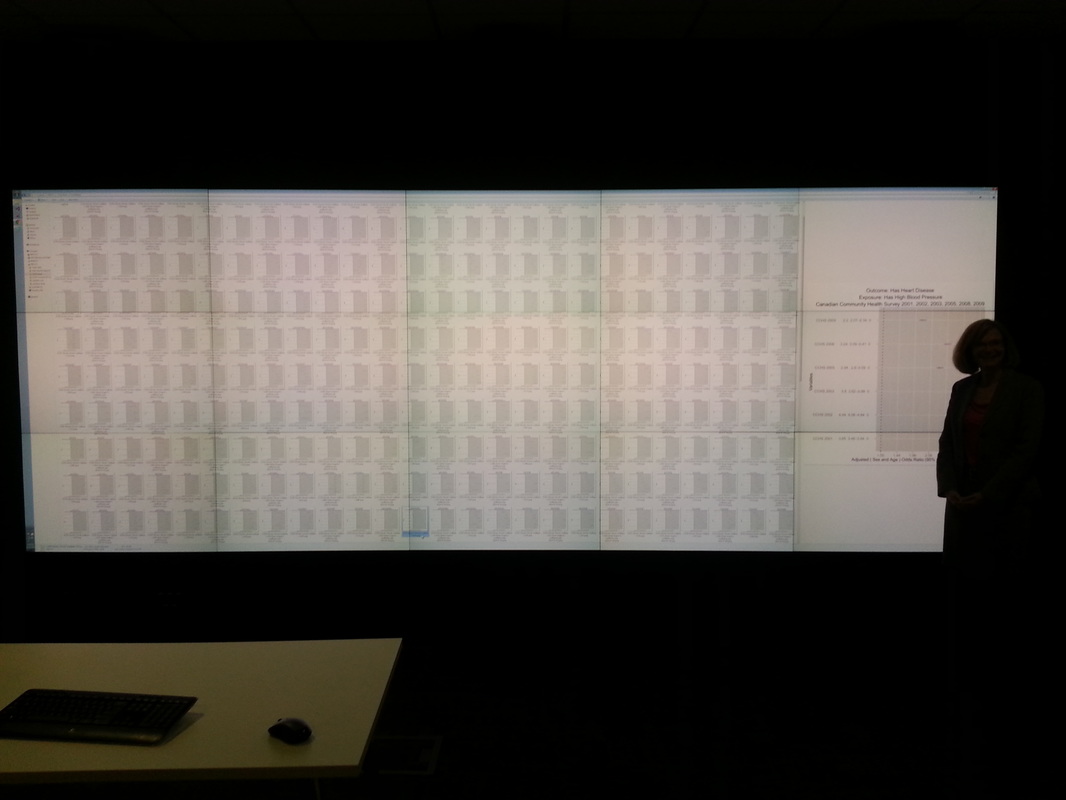
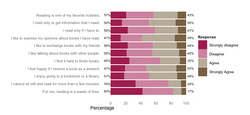
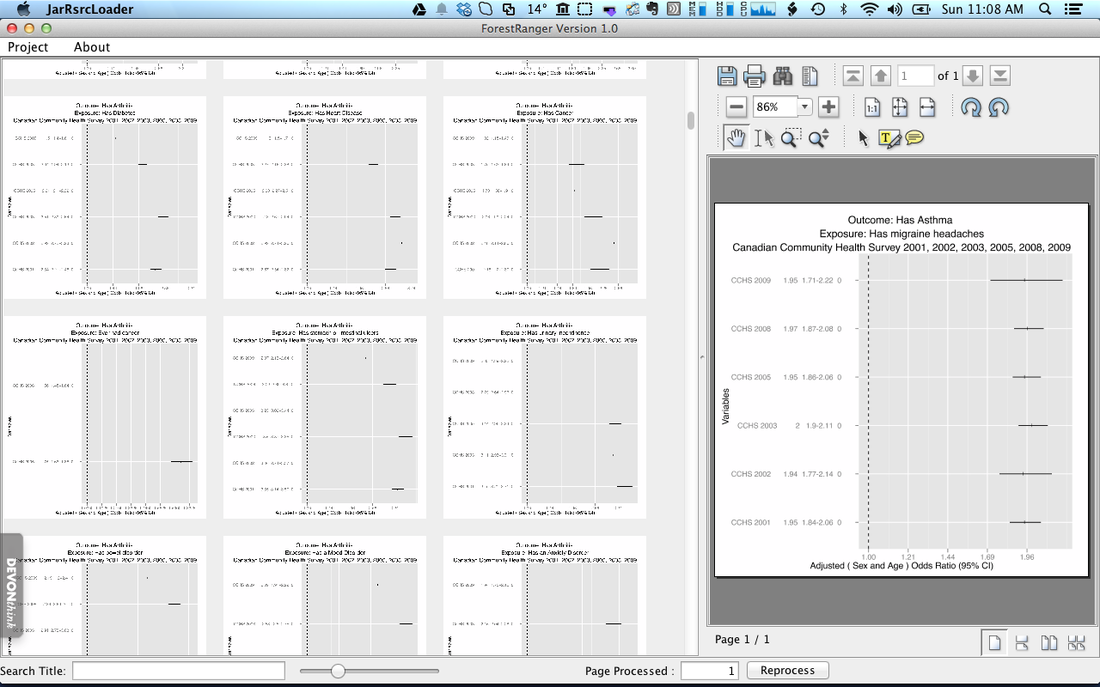
Forest Ranger - The following visualization shows an automated analysis of the Canadian Community Health Survey. Since there are hundreds of Forest Plots showing the association between outcome and exposure, the VisWall is a good medium for displaying all this data.  When a association looks interesting it can be expanded on the right side of the VisWall. The software that generated these forest plots is called ForestRanger.  
Picture
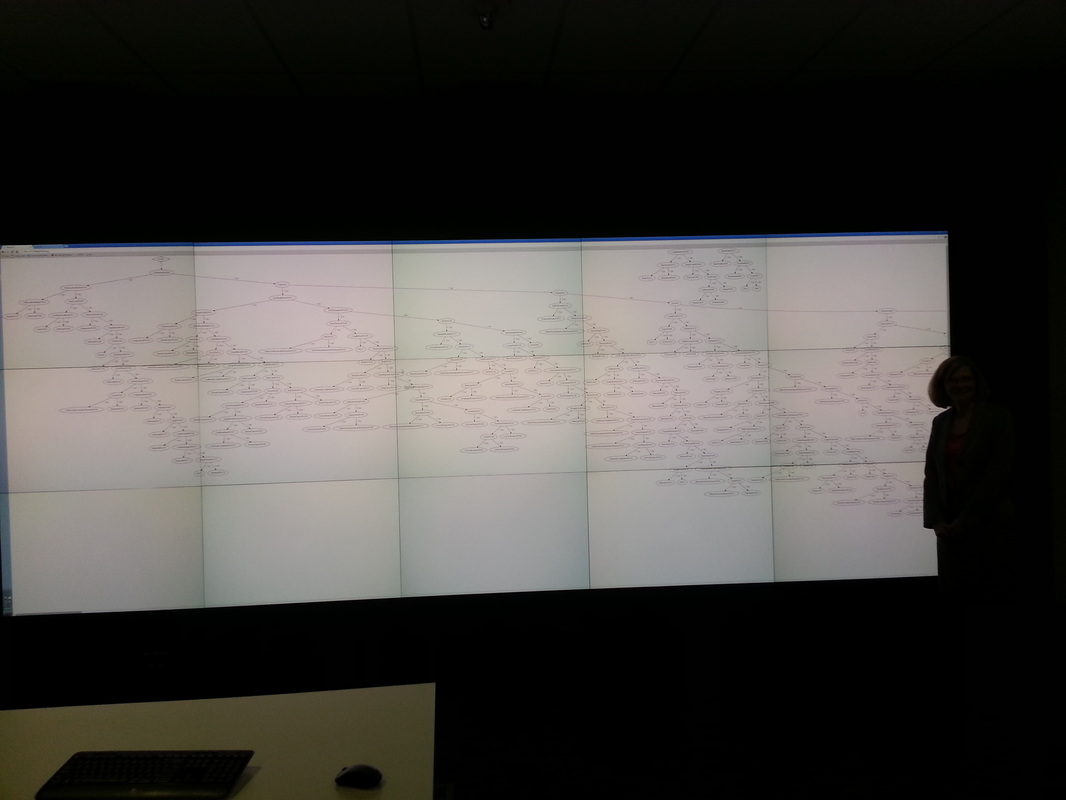
Verbal Autopsy - The following visualization is displaying a Decision Tree based upon the WHO Verbal Autopsy (VA) questionnaire. The VA questionnaire is 17 pages in length and the goal of this project is to establish a 20 question system in which the questions are asked. At present there are 4,000 pathways (sequence of questions) in this decision tree.  
Picture
0 Comments

CCHS Tableau - Beta1

3/12/2015

1 Comment

 
1 Comment

Clinical Workstations, COWs and Thin Clients

7/18/2014

3 Comments

 
Looking back at the 1990s and seeing how computers were established in the clinical environment is an interesting story of the adoption of technology.

Picture
IBM 7690 (1991)


The IBM 7690 is a clinical computer that folds into itself.  It was designed for mounting on a wall.  

Strangely, there is little information on the internet about this product.  
There is a PubMed abstract on this computer:  
Witkowski JA. Microcomputers in nursing practice: IBM 7690 clinical workstation, Part I. J Pediatr Nurs. 1992 Apr;7(2):147-8.

Picture
Tablets

The first hospital based Tablet I saw was the Zenith CruisePad -- it basically was a remote client as you required a Windows NT server to serve up the applications.

Zenith Data Systems CruisePad
Thin Client, Windows 3.1, (1995)

Picture
Thin Clients

Thin clients then came along -- and this was another way to serve up applications from a more powerful server class machines.  

Thin clients also allowed more control of the desktop environment in terms of viruses and non-approved applications (and even usb keys)

Virtual Desktop, 1280x1024 (1999)


Picture
Computers on Wheels (COW)

HP NeoWare e370 Thin Client / eFusion Cart
17 inch, Windows XP Embedded, 1ghz, 512mb flash memory (2006)

Picture
Bonus - Light Pens

The old TDS 7000 Oscar system at the Foothills Medical Centre (FMC) used light pens instead of mice.  Light pens only work with CRT monitors -- so since the world has gone to LCD screens they are no longer in use. 

3 Comments

Web-Based R Servers (Shiny and WebReports)

7/18/2014

0 Comments


Shiny is a web front-end application for R that is part of RStudio.  Shiny is licensed at $9,999/year through RStudio.

http://rstudio.github.io/shiny/tutorial/#welcome

I've been playing with it the last few days and its okay -- I think it is based on some TCL/TK as thats how you set up the webpage -- through a structure like it. 

My first application was to query PubMed and then have t report on the various aspects of it -- such as publication year, journal, authors, etc.

I have not figured out how the inputs work (checkbox, slider, etc).  The documentation explains simple uses of it -- but does not solve my unique use-case.

How does this compare to WebReports:
  • I like the input parameters alot better in WebReports than in Shiny.
  • Shiny has the ability to dynamically change content without refreshing the webpage.
  • WebReports has the ability to email and print reports while Shiny does not.
  • WebReports R was developed in 2007.. so 7 years we can adopt technology from back then. 
  • Shiny is free (non-password version) -- WebReports is unknown.

Dean.


0 Comments

Designing Survey Forms

7/10/2014

1 Comment

 
Picture
Having conducted several surveys I've really thought about what kind of system I would like to have.  

We use RedCap for all of our survey data collection and then export the data as a CSV file and import it into R.  

What I sometimes find is that the data collected is not in the best format for the type of analysis or presentation that I would like.  

What I would like to develop is an interactive Survey Form creator, like RedCap, however have the R statistical code generated right away and the ability to simulate data from within the application.  This way I could then quickly format my tables and analysis and see what the output would look like immediately.

This may be my next "test" project.

R code for Licket Scale: 
http://www.r-bloggers.com/visualizing-likert-items-3/

1 Comment

ForestRanger Version 1.0 released

6/29/2014

1 Comment

 
Forest Ranger (2014) - ForestRanger is an application for visualizing large amount of Forest Plots generated from cross sectional surveys (i.e. Canadian Community Health Survey - CCHS).  The Forest Plot(s) report on the association between outcome and exposure variables (i.e. Stroke versus Hypertension adjusted by sex and age) broken down by survey year (i.e. 2008, 2007, 2006, 2005, etc.).  For a chronic disease series of reports there could be 20 variables reported on which would correspond to approximately 400 charts.  ForestRanger allows a researcher to quickly see which associations are increasing or decreasing or have the greatest Odds Ratios (OR) of the associations.  The researcher can then click on the chart of interest and the larger report appears on the right hand side.  ForestRanger can be used for visualizing any directory of PDFs. 
Picture
1 Comment

    Dean Yergens

    Computer Science, Medical Informatics, Health Services Research, Epidemiology.

    Archives

    September 2019
    January 2018
    December 2017
    September 2017
    August 2017
    May 2017
    March 2017
    January 2017
    November 2016
    September 2016
    August 2016
    June 2016
    May 2016
    March 2016
    February 2016
    January 2016
    November 2015
    October 2015
    March 2015
    August 2014
    July 2014
    June 2014

    Categories

    All
    Epidemiology
    Hacking
    Linux
    Software
    Vintage Computing

    RSS Feed